Website speed describes how quickly an Australian site loads visible content, renders stable layouts and responds to user input. A useful performance review checks mobile and desktop results, real-user field data and controlled lab data rather than relying on one score. Core Web Vitals set measurable benchmarks for loading, responsiveness and visual stability. Server location, caching, CDN configuration and front-end code explain why two pages with similar designs produce different results for Australian visitors. The review starts with representative URLs, identifies the measured bottleneck, orders fixes by user impact and repeats the same test after each change.
What Is Website Speed?
Website speed is the time a page takes to load visible content, render a stable layout and respond to input. A page speed score summarises part of that experience, while individual metrics reveal the stage causing delay.
- Loading performance: includes server response time, file transfer and the arrival of visible content.
- Rendering performance: includes CSS processing, layout calculation, fonts, images and paint work.
- Interaction performance: includes main-thread availability after a tap, click or keyboard action.
Why Does Website Speed Matter?
Website speed matters because delayed content and sluggish interactions add friction to each user path. A slow landing page delays the first useful message. A slow product page delays evaluation. A slow form or checkout delays completion. Search visibility also receives a page-experience signal through Core Web Vitals, alongside relevance and content quality.
- User experience: visitors wait longer for content, navigation and forms.
- Conversion paths: delays appear before enquiries, bookings, downloads and purchases.
- Maintenance: performance checks expose hosting, caching, asset and script issues before they spread across templates.
How Does Website Speed Affect User Experience And Conversions?
Website speed affects user experience and conversions by changing the time between intent and completion. Each delay adds another point where a visitor waits for a message, product image, navigation menu, form field or payment step.
- A slow first render delays the information required to decide whether the page matches the search intent.
- A delayed interaction makes menus, filters, forms and checkout controls feel unresponsive.
- An unstable layout moves buttons, fields and content after they appear, which increases input errors and abandonment risk.
Does Website Speed Affect SEO Rankings?
YES, website speed affects SEO rankings through page-experience signals, including Core Web Vitals. Google Search Central states that Core Web Vitals are used by ranking systems. Relevance, helpful content and other search signals remain part of the ranking decision.
How Do You Test Website Speed Properly?
A proper website speed test uses representative URLs, mobile and desktop runs, field evidence, lab diagnostics and repeat testing. One homepage run does not represent a full site because templates, media, scripts and user paths produce different bottlenecks.
- Choose representative URLs: the homepage, major templates, high-traffic landing pages and conversion pages.
- Run separate mobile and desktop tests because device processing, viewport rules and network conditions differ.
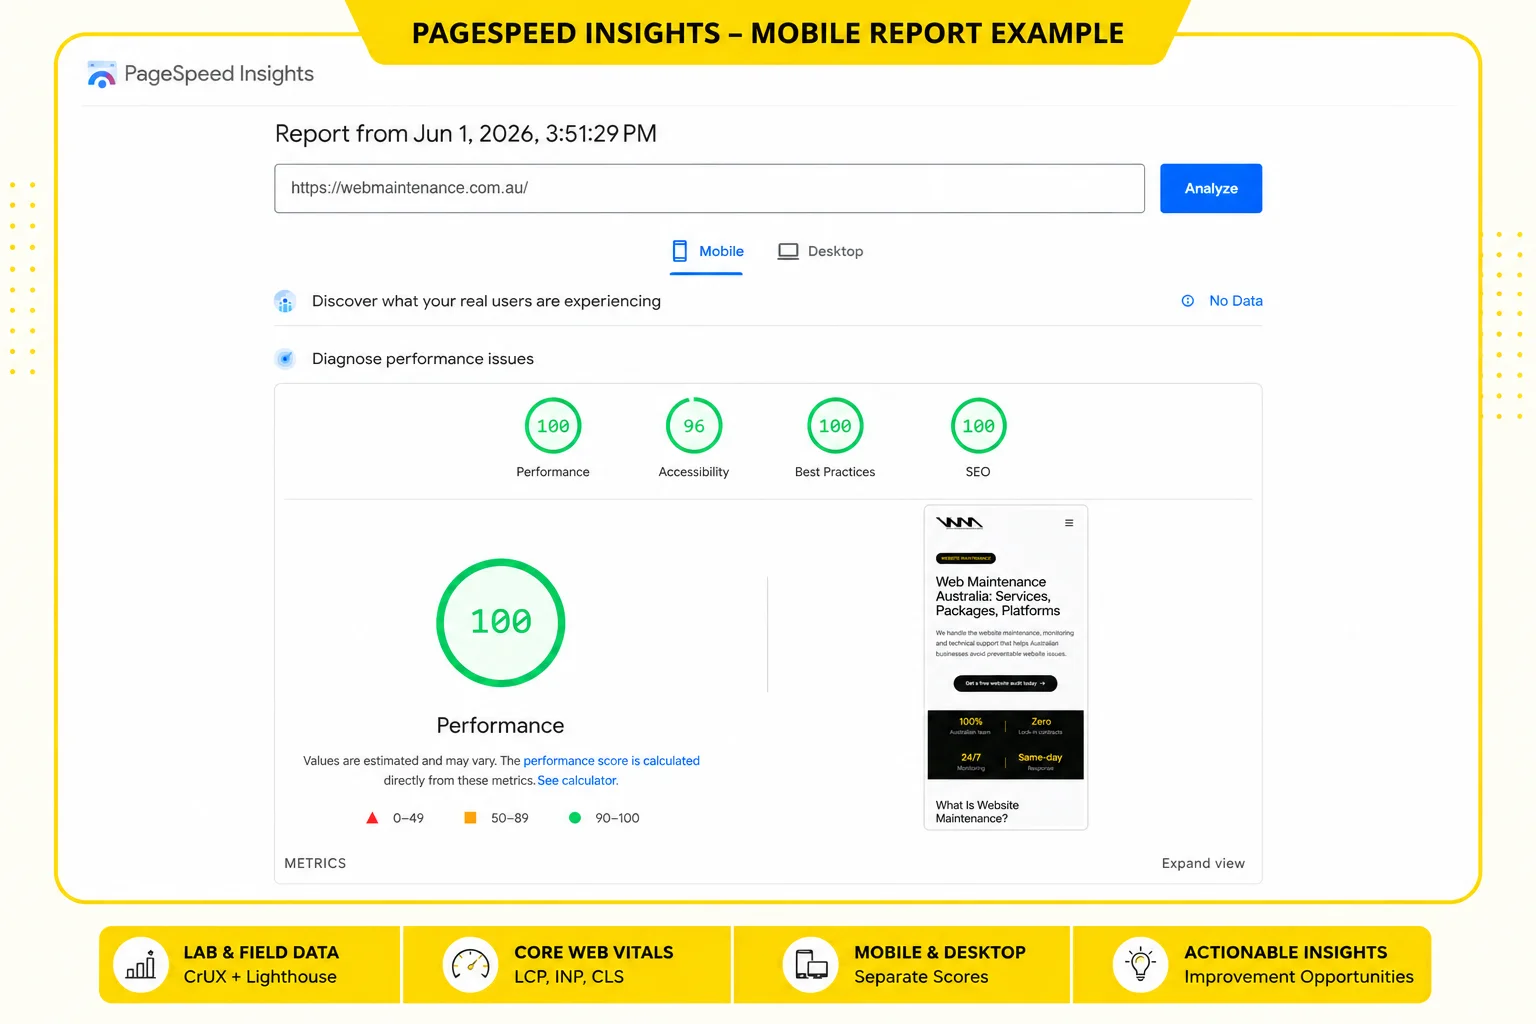
- Start with PageSpeed Insights for URL-level lab and field data, then select a deeper tool when the first report reveals a bottleneck.
- Separate field data from lab data. Field data describes real-user experience over time. Lab data reproduces a controlled load for debugging.
- Identify the failing metric and the largest opportunity, such as slow server response, oversized media, blocking resources or heavy third-party code.
- Change one grouped cause, repeat the same test conditions and compare the new result with the baseline.
Which Pages Should You Test First During A Website Speed Audit?
Test commercially important pages and representative templates first. This sample finds broad template problems and high-impact user-path delays without running the same manual check across every URL.
- Homepage and main navigation entry points
- Service, product, category and article templates
- High-traffic landing pages from analytics or Search Console
- Enquiry, booking, cart and checkout paths
- Known problem pages with large media, embeds or third-party widgets
Which Website Speed Checker Tool Should You Use?
Use the checker that matches the investigation. PageSpeed Insights suits the first review, while waterfall tools and monitoring platforms add request-level, location-specific or historical evidence.
- PageSpeed Insights: suits an initial URL review on mobile and desktop. It combines CrUX field data, Lighthouse lab data, Core Web Vitals and improvement opportunities. It tests one URL at a time and does not replace ongoing site monitoring.
- GTmetrix: suits synthetic debugging after a slow request or large page weight appears. It reports Lighthouse metrics, waterfall requests, page size, request count and Sydney test-location options. The selected lab environment describes that configured run rather than every real-user visit.
- Pingdom: suits quick synthetic reviews and recurring page-speed monitoring. It reports load time, requests, page size, region selection and element-level details. Synthetic conditions require separate real-user evidence for Core Web Vitals decisions.
- DebugBear: suits performance monitoring, regression review and Core Web Vitals investigation. It combines scheduled Lighthouse tests, real-user monitoring, CrUX data and network diagnostics. Ongoing monitoring setup exceeds the scope of a quick one-off check.
- WebPageTest: suits detailed synthetic debugging with repeatable conditions. It provides test-location choice, browser choice, repeat runs, request waterfalls and visual filmstrips. Advanced controls add interpretation work and test queues affect completion time.
- Uptrends: suits geographic comparison and element-level page review. It provides desktop or mobile checks, worldwide locations, Core Web Vitals, waterfall reports and page-element distribution. One free-tool snapshot does not replace scheduled monitoring or site-wide real-user data.
How Do You Read Website Speed Test Results?
Read speed test results from summary to cause. The top score identifies the overall test outcome, while field data, individual metrics and diagnostic opportunities show the bottleneck that deserves the first fix.
- Check the mobile and desktop performance scores for a quick comparison.
- Read field data before drawing conclusions about real-user experience.
- Inspect LCP, INP and CLS to identify loading, responsiveness or layout-stability problems.
- Use lab diagnostics to find the resource, script, server delay or rendering step linked to the failing metric.
- Apply one priority fix and rerun the same page under the same conditions.
What Is The Difference Between Lab Data And Field Data?
Lab data is a controlled synthetic page load, while field data is anonymised real-user performance data. Google About PageSpeed Insights documentation states that PSI presents both because controlled diagnostics and real-world experience answer different questions.
| Data type | What it represents | Best use | Main limitation |
|---|---|---|---|
| Lab data | A simulated load on one device profile with fixed network conditions. | Debugging a reproducible bottleneck and checking a change immediately. | The configured run does not represent every visitor device, connection or behaviour. |
| Field data | Real-user experience across devices and network conditions, reported through CrUX in PSI. | Assessing Core Web Vitals outcomes and spotting real-world differences. | The historical data set has fewer diagnostics and requires sufficient traffic. |
What Is A Good Website Speed?
A good website speed result meets Core Web Vitals thresholds at the 75th percentile and produces a useful mobile experience. Google's web.dev Web Vitals documentation defines the thresholds. Google About PageSpeed Insights documentation classifies Lighthouse performance scores separately.
| Measure | Good benchmark | What it tells you |
|---|---|---|
| Largest Contentful Paint (LCP) | 2.5 seconds or less | The main visible content loads promptly. |
| Interaction to Next Paint (INP) | 200 milliseconds or less | Interactions receive a prompt visual response. |
| Cumulative Layout Shift (CLS) | 0.1 or less | Visible content remains stable during the visit. |
| PageSpeed Insights performance score | 90 to 100 | The controlled Lighthouse run sits in the Good score band. |
| PageSpeed Insights performance score | 50 to 89 | The controlled Lighthouse run sits in the Needs Improvement band. |
| PageSpeed Insights performance score | 0 to 49 | The controlled Lighthouse run sits in the Poor band. |
A score does not describe the whole site. Template sampling, mobile results, field data and conversion-path testing remain part of the performance review.
Which Core Web Vitals Matter For Website Speed?
The current Core Web Vitals are LCP, INP and CLS. Google web.dev guidance uses these metrics to assess loading performance, responsiveness and visual stability at the 75th percentile of page loads.
| Metric | Attribute measured | Good threshold | Typical investigation |
|---|---|---|---|
| LCP | Loading performance for the largest visible content element. | 2.5 seconds or less | Hero media, server response, caching and render path. |
| INP | Responsiveness after user interactions. | 200 milliseconds or less | Long JavaScript tasks, third-party code and main-thread work. |
| CLS | Visual stability across unexpected layout shifts. | 0.1 or less | Media dimensions, font swaps, banners, embeds and injected content. |
Which Additional Metrics Help Diagnose Speed Problems?
Additional metrics reveal where the loading path slows down. Google web.dev and Lighthouse documentation use TTFB, FCP, Speed Index and Total Blocking Time as diagnostic signals alongside Core Web Vitals.
| Metric | What it measures | Diagnostic value |
|---|---|---|
| Time to First Byte (TTFB) | Time until the first response byte arrives. | Points to origin-server response, redirects or network latency. |
| First Contentful Paint (FCP) | Time until the first text, image or visible content renders. | Points to response delay and render-blocking resources. |
| Speed Index | How quickly visible content fills the viewport during the lab run. | Reveals slow visual progression across the initial render. |
| Total Blocking Time (TBT) | Main-thread blocking between FCP and Time to Interactive in a lab run. | Acts as a lab diagnostic for script-heavy responsiveness problems. |
Why Is Website Speed Different On Mobile And Desktop?
Mobile and desktop speed differ because device processing, network conditions, viewport rules and delivered assets change the workload. A fast desktop score does not prove a fast mobile experience.
- Mobile processors often complete JavaScript and layout work more slowly than desktop processors.
- Mobile connections add latency and bandwidth variation that a fixed office connection does not show.
- Responsive layouts alter image sizes, menus, fonts and visible components.
- Mobile test profiles often expose script, image and third-party costs hidden by faster desktop hardware.
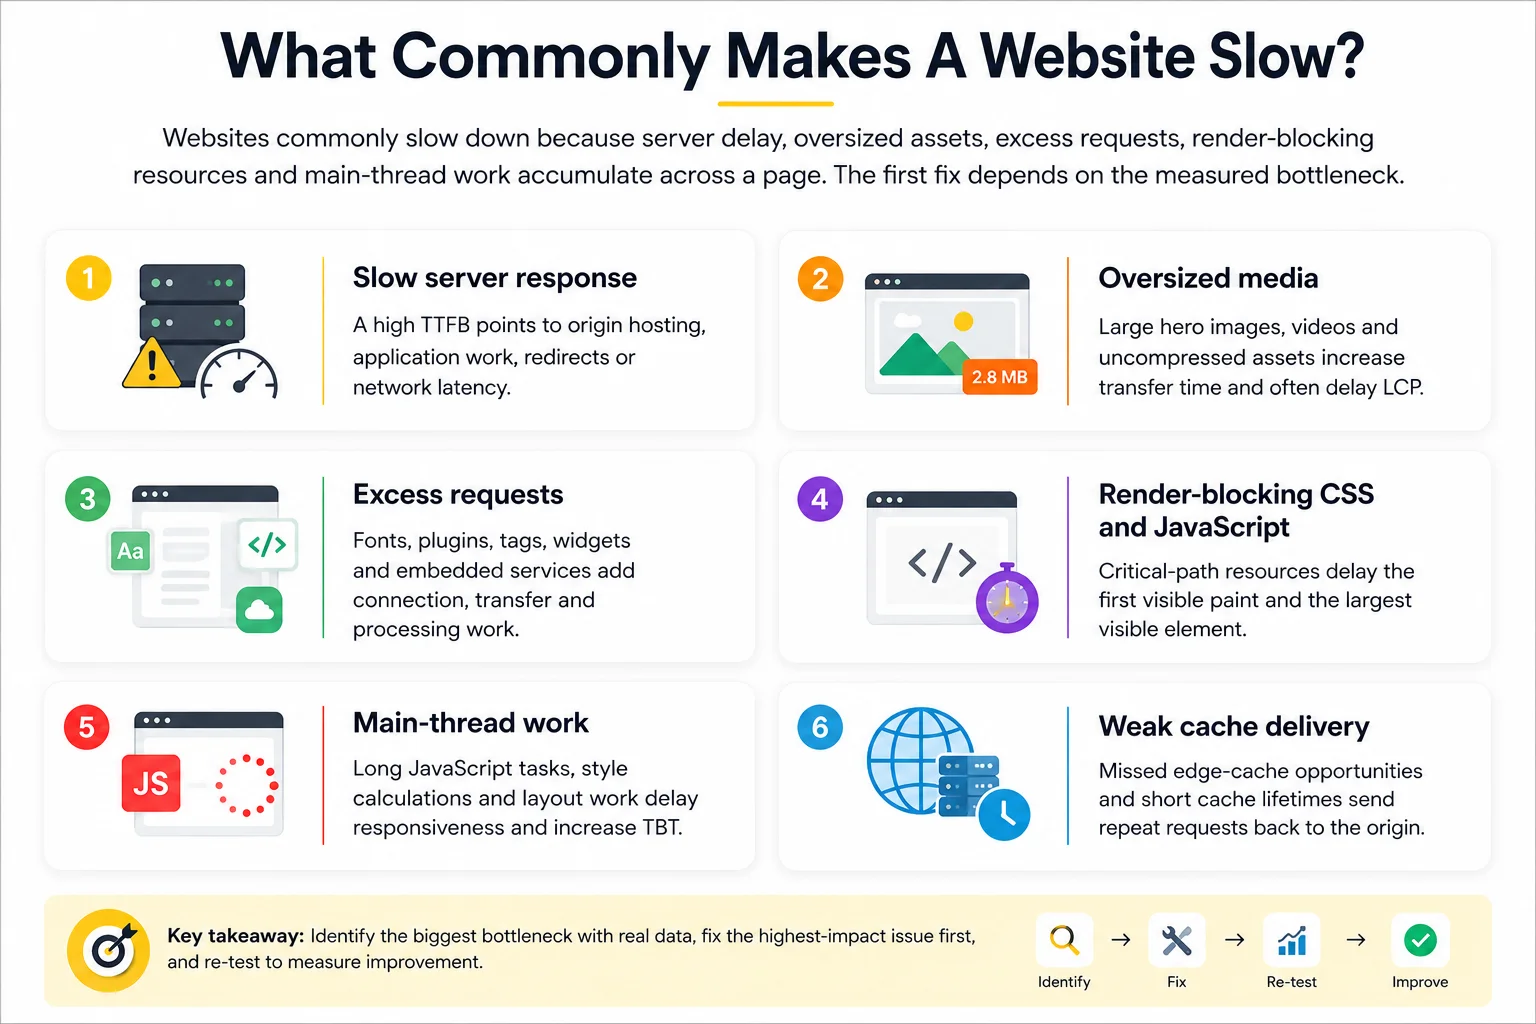
What Commonly Makes A Website Slow?
Websites commonly slow down because server delay, oversized assets, excess requests, render-blocking resources and main-thread work accumulate across a page. The first fix depends on the measured bottleneck.
- Slow server response: a high TTFB points to origin hosting, application work, redirects or network latency.
- Oversized media: large hero images, videos and uncompressed assets increase transfer time and often delay LCP.
- Excess requests: fonts, plugins, tags, widgets and embedded services add connection, transfer and processing work.
- Render-blocking CSS and JavaScript: critical-path resources delay the first visible paint and the largest visible element.
- Main-thread work: long JavaScript tasks, style calculations and layout work delay responsiveness and increase TBT.
- Weak cache delivery: missed edge-cache opportunities and short cache lifetimes send repeat requests back to the origin.
How Do Caching, A CDN And Hosting Affect Website Speed?
Caching, a CDN and hosting affect different parts of delivery. Caching reduces repeat work, a CDN serves cached content closer to visitors and hosting controls origin response for uncached or dynamic requests.
Caching acts in the browser, application, server or CDN edge. It reuses stored content and reduces repeated processing or transfer. Incorrect cache rules reduce hit rates or serve stale content.
A CDN uses distributed edge locations between the visitor and origin. It reduces delivery distance for cached assets and offloads origin traffic. Dynamic or uncached requests still reach the origin.
Hosting controls the origin server and application environment. It affects backend processing, capacity, storage and origin response. A distant or slow origin still affects cache fills and dynamic pages.
Cloudflare CDN documentation identifies low cache-hit ratios, cache-rule conflicts and origin-server issues as reasons a CDN setup produces limited performance improvement.
How Does Server Location Affect Australian Users?
Server location affects Australian users through distance-related network latency. A request from Sydney to a distant origin takes longer than a request served from a nearby Australian edge location or local origin.
Cloudflare edge-server documentation explains that origin-only requests travel to the physical origin location and load times increase as distance increases. Australian testing requires an Australian test location, a cache-status check and a separate review of dynamic requests that still reach the origin.
How Do JavaScript, CSS And Third-Party Scripts Slow A Website Down?
JavaScript, CSS and third-party scripts slow a page through extra transfer, render blocking and main-thread work. Google web.dev documentation identifies synchronous third-party JavaScript in the critical rendering path as a source of delayed document parsing.
- JavaScript: remove unused code, split large bundles and break long main-thread tasks into smaller work units.
- CSS: keep critical styles small, remove unused rules and defer non-critical style delivery where the implementation allows it.
- Third-party scripts: remove unnecessary tags, load non-critical scripts with async or defer and inspect analytics, chat, advertising and embedded services separately.
- Validation: compare the request waterfall, FCP, LCP and TBT before and after each grouped change.
Why Do Website Speed Test Scores Vary?
Website speed scores vary because test conditions and live delivery conditions change between runs. A single result is a data point, while repeated runs reveal the pattern.
- Network route, bandwidth and latency change the transfer path.
- Test location changes the distance to the origin and CDN edge.
- Device profile and browser configuration change processing and rendering work.
- Server load, cache state and background application work change response times.
- Tool methodology changes throttling, scoring, run count and reported metrics.
Which Website Speed Fixes Should Be Prioritised First?
Prioritise speed fixes by measured bottleneck, affected template and user-path value. A general checklist becomes useful after the audit shows which delay affects the important pages.
- Fix critical availability and origin-response problems first. High TTFB, repeated server errors and unstable hosting affect every uncached request.
- Reduce the largest LCP asset and oversized media transfers. Resize delivery dimensions, compress files, select an efficient format and apply responsive image markup.
- Remove unnecessary requests. Delete unused plugins, duplicate tags, redundant fonts and scripts with no measured business function.
- Reduce render-blocking and main-thread work. Review critical CSS, JavaScript bundles, long tasks and third-party execution cost.
- Configure caching and CDN delivery. Check cache headers, edge-cache rules, hit rates and Australian test-location results.
- Retest the same representative pages. Record the baseline, changed resource group, new lab result and later field-data outcome.
How Often Should Website Speed Be Tested And Monitored?
Test website speed at baseline, after significant updates and on a recurring maintenance schedule. For sites running WordPress, wordpress web maintainence should include recurring speed checks because plugin, theme, media and script changes can affect performance over time.
- Baseline: record representative mobile and desktop results before remediation work.
- Release test: rerun affected templates after theme, plugin, script, media or infrastructure changes.
- Recurring audit: review the representative set monthly for frequently changed sites or quarterly for low-change sites.
- Monitoring: track critical landing pages, forms, cart paths and checkout flows when rapid regression detection matters.
Is A Perfect PageSpeed Score Required For A Fast Website?
NO, a perfect PageSpeed score is not required for a fast website. A score of 90 to 100 sits in Google's Good band, while field data, mobile results and important user paths provide the practical performance evidence. Ongoing website support and maintenance should focus on stable user experience, Core Web Vitals and conversion-path performance instead of chasing a perfect score only.
Can A Website Be Fast On Desktop But Slow On Mobile?
YES, a website is often fast on desktop and slow on mobile because mobile network conditions, processors, responsive assets and JavaScript cost differ. Separate tests expose work hidden by faster desktop hardware and stable office connections.
Should Every Page On A Website Be Speed Tested?
NO, every page does not require an individual manual speed test during each audit. Representative templates, high-traffic pages and conversion paths find broad problems first. Targeted retesting covers pages affected by later changes.
Can A CDN Improve Website Speed For Australian Visitors?
YES, a CDN improves delivery for Australian visitors when nearby edge locations serve correctly cached content. Australian test locations reveal the result. Dynamic requests, low cache-hit ratios and slow origin responses still require separate fixes.
Do Large Images Always Slow A Website Down?
NO, large visual dimensions do not always create a slow page. Delivered file weight, format, compression, responsive image markup and lazy-loading rules determine the transfer and rendering cost. Oversized uncompressed files remain a common LCP problem.
Can Third-Party Scripts Reduce Website Speed?
YES, third-party scripts reduce website speed through extra requests, connection setup, main-thread work and render blocking. Analytics, chat, advertising and embedded services require separate review, followed by removal or careful loading rules. These checks help protect lead quality and digital marketing results because slow pages can reduce form submissions, bookings, enquiries and ecommerce actions.
Should Website Speed Be Retested After Site Updates?
YES, website speed requires retesting after site updates because themes, plugins, scripts, media and infrastructure changes alter page performance. The same representative-page review checks loading, rendering and usable interaction against the earlier testing baseline, benchmark table and prioritised fixes.
Retesting also helps separate website performance problems from broader technology issues. When speed, DNS, hosting, email delivery or internal access overlap, the service boundary explained in website vs IT support helps decide which provider should investigate first.
For budgeting, speed testing should be included in the maintenance scope before work begins. A clear website maintenance cost model should define testing frequency, supported templates, reporting, fix limits and any extra cost for advanced optimisation work.